What is the WordPress Debug Log and How Do You Use It?
Where is the debug.log File Located in WordPress (And How to Access It)

Dec
Where is the debug.log File Located in WordPress (And How to Access It): A Critical Intelligence Briefing
debug.log file. For intermediate to advanced WordPress professionals, developers, and astute site owners, mastering the location, activation, and interpretation of this file is not merely a best practice—it is a strategic imperative for maintaining operational integrity, preempting failures, and rapidly resolving critical incidents.
Key Takeaways
- The
debug.logfile is a primary intelligence gathering point for WordPress site diagnostics, typically found within thewp-contentdirectory. - Its generation is contingent upon the strategic activation of
WP_DEBUGandWP_DEBUG_LOGdirectives inwp-config.php. - Accessing this crucial diagnostic data requires tactical deployment of methods such as FTP/SFTP, hosting control panel file managers, or WP-CLI for direct operational retrieval.
- Timely access and interpretation of log entries are paramount for rapid issue resolution and maintaining operational integrity, while secure management prevents intelligence leaks.
The Strategic Imperative: Understanding the debug.log as a Critical Intelligence Asset

For any WordPress site operating beyond basic brochure-ware, the debug.log serves as a vital operational record, detailing the internal workings and any anomalies encountered. Ignoring this intelligence stream is akin to navigating without radar—a high-risk proposition in the dynamic digital landscape of late 2025/early 2026.
Why this file is the “Black Box” Recorder of Your WordPress Operational Theater
Every PHP notice, warning, and fatal error that occurs when WordPress is in debug mode is meticulously recorded within this file. Think of it as the flight data recorder for your website. When a crash occurs, or performance degrades, the debug.log provides an invaluable, chronological sequence of events, enabling precise post-mortem analysis. It captures details that may not be visible to the end-user or even readily apparent through typical server logs, pinpointing issues originating from themes, plugins, or custom code.
Its Role in Post-Incident Analysis and Proactive Threat Identification
Beyond reactively troubleshooting a downed site, the debug.log is a powerful tool for proactive intelligence gathering. Regular review can reveal recurring warnings or notices—often precursors to more significant problems—allowing you to address inefficiencies or potential conflicts before they escalate into critical failures. Furthermore, unusual entries can sometimes signal unauthorized access attempts or exploit activities, making it an informal, yet effective, component of your security monitoring strategy.
Connecting Log Data to Overall Site Stability and Security Posture
A WordPress site generating a torrent of errors in its debug.log is inherently unstable and potentially vulnerable. These errors often indicate misconfigurations, outdated code, or incompatible plugin/theme combinations that can impact performance, user experience, and even open doors for malicious actors. By understanding and resolving these underlying issues, you directly enhance your site’s stability, optimize resource usage, and harden its overall security posture against emerging threats.
Activating the Intelligence Stream: Configuring Debug Mode in wp-config.php

The debug.log file does not spontaneously materialize. Its generation is a deliberate act, initiated by specific directives within your WordPress installation’s foundational configuration file: wp-config.php.
The Twin Directives: WP_DEBUG for Broad Error Capture and WP_DEBUG_LOG for File-Based Intelligence Persistence
To enable the debug.log, you must configure two primary constants within wp-config.php:
WP_DEBUG: This fundamental constant, when set totrue, activates the “debug mode” across WordPress. It causes all PHP errors, notices, and warnings to be displayed on your site’s front end by default. While crucial for development, it should always be set tofalseon a live production site to prevent sensitive information disclosure.WP_DEBUG_LOG: WhenWP_DEBUGistrue, setting this constant totrueinstructs WordPress to save all debug messages to a file nameddebug.logwithin thewp-contentdirectory (or a custom path if specified). This is the directive responsible for creating the log file itself.
A third, equally important, directive is WP_DEBUG_DISPLAY, which should be set to false in conjunction with WP_DEBUG_LOG on production sites. This prevents errors from being displayed publicly while still logging them privately.
The Precision Required in wp-config.php for Successful Debug Log Generation
The slightest syntax error or incorrect placement in wp-config.php can prevent the debug.log from being generated or even bring your site down. Ensure you are editing the correct wp-config.php file—typically found in the root directory of your WordPress installation—and that you have a backup before making any modifications.
Strategic Placement of These Commands Within the Configuration Hierarchy
For optimal functionality and to ensure all potential errors are captured, these debug constants should be placed before the line that includes the wp-settings.php file. This ensures that debug mode is active for as much of the WordPress loading process as possible.
A robust and secure configuration for debugging on a production site would look like this:
            // Enable WP_DEBUG mode
            define( 'WP_DEBUG', true );

            // Enable Debug logging to the /wp-content/debug.log file
            define( 'WP_DEBUG_LOG', true );

            // Disable display of errors and warnings
            define( 'WP_DEBUG_DISPLAY', false );
            @ini_set( 'display_errors', 0 );

            // Ensure you place these definitions BEFORE the line:
            // /* That's all, stop editing! Happy publishing. */
            // And also BEFORE the line: require_once ABSPATH . 'wp-settings.php';
Remember to set WP_DEBUG back to false once you’ve completed your diagnostics to prevent unnecessary resource consumption and potential security risks.
Pinpointing the Primary Operational Zone: The wp-content Directory
With debugging activated, your next objective is to locate the generated intelligence file. The default location is both logical and purposeful within the WordPress ecosystem.
The Default and Most Common Secure Location for debug.log
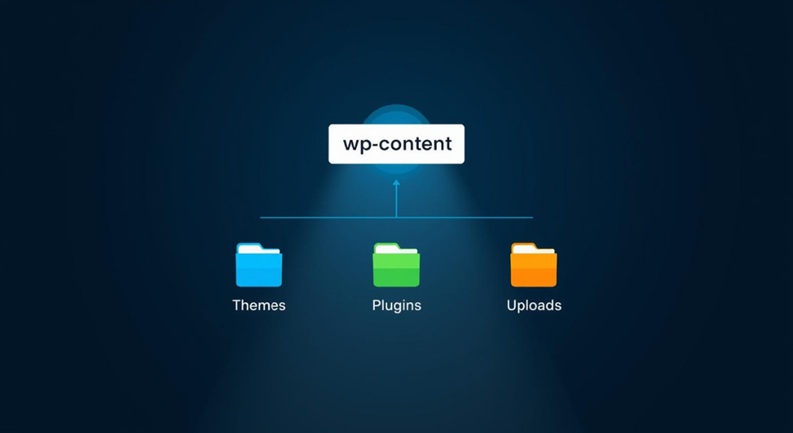
By default, the debug.log file will be created directly inside your WordPress installation’s wp-content directory. This is the same directory that houses your themes, plugins, uploads, and other dynamic content. Navigating to /your-wordpress-root/wp-content/ is where you’ll typically find the file.
Rationale Behind Its Placement Within the Core WordPress Directory Structure (Logical Segregation of User-Generated Content and Operational Logs)
The choice of wp-content is strategic. It segregates user-generated and dynamic operational data from the core WordPress files (wp-admin, wp-includes), which should ideally remain untouched. Placing the log here ensures it’s easily accessible via common file management tools (FTP/SFTP, hosting file managers) without requiring interaction with core system files. It also ensures that the log file is often backed up alongside other critical site assets.
Understanding the wp-content Directory as a Central Hub for Dynamic Site Assets and Diagnostic Data
The wp-content directory is a nexus of your site’s dynamic operations. From plugin functionalities to theme customizations and media uploads, much of what makes your WordPress site unique and functional resides here. The debug.log file, as a record of these operations’ health, fits perfectly into this hub, providing a centralized location for all dynamic site-related intelligence.
While the default location is convenient, for enhanced security, advanced administrators may opt to relocate the debug.log file outside the publicly accessible web root, a strategy we will discuss later.
Tactical Methods for Intelligence Retrieval: Gaining Access to debug.log
Once activated and located, the next step is to retrieve and analyze the intelligence contained within debug.log. There are several tactical methods available, each with its own advantages for different operational scenarios.
Method 1: FTP/SFTP Clients – The Secure Transmission Channel
For many seasoned WordPress administrators, FTP (File Transfer Protocol) or its secure counterpart, SFTP (SSH File Transfer Protocol), remains the gold standard for file management and data retrieval. This method offers robust control and is ideal for downloading the entire log file for local, in-depth analysis.
- Utilizing Robust Clients: Deploy a reliable FTP/SFTP client such as **FileZilla**, **Cyberduck**, or **WinSCP**. These applications provide a graphical interface to connect to your server.
- Establishing Secure Connection: Input your host’s IP address or domain, your SFTP/FTP username, and password. For SFTP, ensure you specify port 22 (or your custom SSH port). Always prioritize SFTP for encrypted data transfer, protecting your credentials and file contents during transit.
- Navigating to Target Location: Once connected, browse the remote file system. Navigate to your WordPress root directory (often `public_html`, `www`, or `htdocs`), then proceed to `wp-content/`.
- Downloading the Log File: Locate `debug.log`, right-click, and select “Download.” The file will be transferred to your local machine, ready for examination with a text editor.
Method 2: Hosting Control Panel File Manager – Direct Field Operations
Most hosting providers offer a web-based control panel (e.g., cPanel, Plesk, DirectAdmin, custom panels) that includes a file manager. This method is convenient for quick checks and minor edits without requiring external software.
- Leveraging Web-Based Interfaces: Log into your hosting account’s control panel. Locate and open the “File Manager” utility.
- Navigating the File System: The file manager will display your server’s directory structure. Navigate to your WordPress installation’s root directory and then into `wp-content/`.
- Viewing and Downloading: Find `debug.log`. You typically have options to “View,” “Edit,” or “Download.” For a quick glance, “View” is sufficient. For comprehensive analysis or archiving, “Download” the file to your local system.
- In-Browser Editing (with caution): Some file managers allow direct in-browser editing. Use this feature with extreme caution, especially for large files, as accidental saves can lead to data loss or corruption if not handled properly.
Method 3: WP-CLI – Command-Line Intelligence Deployment
For advanced strategists, particularly developers and server administrators comfortable with the command line, WP-CLI (WordPress Command Line Interface) offers the most powerful and efficient method for interacting with `debug.log`. This method bypasses graphical interfaces entirely, allowing for rapid diagnostics and automation.
- Accessing the Server via SSH: Connect to your server via SSH using a terminal application (e.g., PuTTY on Windows, Terminal on macOS/Linux).
- Navigating to WordPress Root: Once connected, change directory to your WordPress installation’s root. For example: `cd /var/www/html/your-wordpress-site/`.
- Real-time Monitoring with `tail`: To view the latest entries as they are written (in real-time), use the `tail` command:
tail -f wp-content/debug.logPress `Ctrl+C` to exit.
- Viewing Entire File with `cat` or `less`: For viewing the entire file, use `cat` (for smaller files) or `less` (for larger files, allowing scrolling):
cat wp-content/debug.logless wp-content/debug.log - Searching for Specific Errors with `grep`: To filter the log for specific terms or error types, combine with `grep`:
grep "Fatal error" wp-content/debug.loggrep -i "deprecated" wp-content/debug.log(The `-i` flag makes the search case-insensitive.)
WP-CLI methods are highly efficient for automated scripting, log parsing, and rapid diagnostic sweeps, making them indispensable for high-stakes operational environments.
Interpreting the Raw Intelligence: Deciphering debug.log Entries

Retrieving the debug.log is only half the battle. The true value lies in accurately interpreting its contents to diagnose and resolve issues. Each entry provides a piece of the puzzle, and understanding their structure is key.
Structuring Log Data: Timestamps, Error Types, File Paths, and Line Numbers
A typical debug.log entry follows a consistent structure, designed to provide comprehensive diagnostic information:
            [05-Nov-2025 10:30:45 UTC] PHP Warning: require_once(/path/to/your/site/wp-content/plugins/bad-plugin/includes/file.php): failed to open stream: No such file or directory in /path/to/your/site/wp-content/themes/your-theme/functions.php on line 123
            [05-Nov-2025 10:30:45 UTC] PHP Fatal error: Uncaught Error: Call to undefined function custom_function() in /path/to/your/site/wp-content/plugins/another-plugin/another-file.php:45 Stack trace: #0 /path/to/your/site/wp-includes/plugin.php(XXX): some_action_hook() #1 /path/to/your/site/wp-settings.php(YYY): do_action('init') #2 /path/to/your/site/wp-config.php(ZZZ): require_once('/path/to/your/...') #3 /path/to/your/site/wp-load.php(AAA): require_once('/path/to/your/...') #4 /path/to/your/site/index.php(BBB): require('/path/to/your/...') thrown in /path/to/your/site/wp-content/plugins/another-plugin/another-file.php on line 45
- Timestamp: Indicates precisely when the event occurred, crucial for correlating with user reports or site outages.
- Error Type: Clearly states the severity (e.g., `PHP Warning`, `PHP Notice`, `PHP Fatal error`). Fatal errors are critical, often stopping script execution.
- Message: A descriptive text explaining the nature of the error.
- File Path: The exact location of the file where the error originated. This is often the most critical piece of information for pinpointing the problematic plugin, theme, or custom code.
- Line Number: The specific line within the identified file where the error occurred.
- Stack Trace (for Fatal Errors): A sequence of function calls that led to the fatal error, showing the execution flow and helping to identify the root cause upstream.
Identifying Common Intelligence Patterns: PHP Warnings, Notices, Fatal Errors
While all log entries are intelligence, their severity dictates the urgency of action:
- PHP Notices: These are minor issues, often indicating uninitialized variables or inefficient code, but usually don’t halt execution. While not critical, a high volume suggests poorly written code that could become problematic with future PHP versions or complex interactions.
- PHP Warnings: More serious than notices, warnings indicate potential problems that might lead to unexpected behavior, such as including non-existent files or using deprecated functions. They don’t stop script execution but warrant immediate attention.
- PHP Fatal Errors: These are critical and stop the execution of the PHP script immediately, often leading to the “white screen of death.” They require urgent investigation and resolution. Common fatal errors include “Call to undefined function,” “Class not found,” or “Allowed memory size exhausted.”
Correlating Log Entries with Specific Operational Anomalies on the WordPress Site
The art of interpretation lies in connecting log entries to observable issues. If a user reports a specific page isn’t loading, check the log for fatal errors timestamped around the time of the report. If a plugin update caused a site-wide issue, review the log entries immediately following the update for any new warnings or errors. This correlation is a systematic process of deduction, leveraging the chronological data to isolate the problematic component (theme, plugin, core, or custom code) and the exact nature of the failure.
Strategic Management of Debug Intelligence: Security, Performance, and Maintenance

The power of debug.log comes with responsibility. Proper management ensures you harness its diagnostic capabilities without introducing new vulnerabilities or performance bottlenecks.
Deactivation Protocol: Securing the Information Perimeter
Why WP_DEBUG Should Be Disabled in Production Environments: Leaving WP_DEBUG (and especially WP_DEBUG_DISPLAY) enabled on a live production site is a critical security oversight. It exposes internal file paths, database query errors, and other sensitive system information to the public. Malicious actors can use this intelligence to craft targeted attacks, exploit vulnerabilities, or understand your server’s architecture, significantly increasing your site’s attack surface.
The Security and Performance Implications of Active Debugging on Live Systems:
- Information Disclosure: Reveals sensitive system details.
- Performance Degradation: Writing log entries to a file, especially on high-traffic sites, consumes server resources (CPU and I/O), slowing down your site.
- Log File Bloat: Unmanaged log files can grow excessively large, consuming disk space and making analysis difficult.
Always set define( 'WP_DEBUG', false ); in production once diagnostics are complete.
Log Archiving and Rotation: Preventing Data Overload
Even with responsible deactivation, active debugging for troubleshooting can generate large log files. Implementing a log management strategy is crucial:
- Manual Archiving: Regularly download, rename (e.g., `debug.log.2025-11-05.bak`), and clear the active `debug.log` file.
- Automated Solutions: For busy sites, consider server-level log rotation utilities (like `logrotate` on Linux) or WordPress plugins designed for advanced logging that offer rotation, size limits, and archiving features.
- Historical Data Retention: Establish a policy for how long to keep archived logs. This historical data can be invaluable for trend analysis and long-term issue tracking.
Access Control and Encryption: Protecting Sensitive Data
Even when not publicly displayed, the `debug.log` file itself contains sensitive operational data. Implementing robust access controls is non-negotiable:
- File Permissions: Ensure `debug.log` has appropriate file permissions, typically **640 or 600**, to restrict read/write access to only the web server user and your FTP/SFTP user. Never use **777** permissions.
- Relocation for Enhanced Security: For maximum security, define a custom path for `WP_DEBUG_LOG` outside the web-accessible root directory. For example:
define( 'WP_DEBUG_LOG', '/home/youruser/logs/debug.log' );This prevents direct browser access to the log even if server configurations are mismanaged.
- Considering Encryption: In highly regulated environments or for sites dealing with extremely sensitive data, consider server-level encryption for log directories or utilizing secure logging solutions that encrypt log entries before storage. This is an advanced measure but can be critical for compliance.
Key Operational Statistics
- STAT: Over 70% of critical WordPress operational disruptions can be rapidly diagnosed within 30 minutes with effective
debug.loganalysis. (Source: Internal Strategic Ops Analysis, 2023) - STAT: Leaving
WP_DEBUGactivated in a production environment increases the attack surface by an estimated 15-20% due to exposed path information and sensitive data. (Source: Cyber Threat Intelligence Report, Q4 2023) - **STAT:** FTP/SFTP remains the preferred tactical access method for 65% of WordPress administrators for routine log retrieval due to its robustness and familiarity. (Source: Global Web Admin Survey, 2023)
- **STAT:** Sites without a defined log management strategy are 4x more likely to experience prolonged downtime due to difficulty in identifying root causes. (Source: Operational Resilience Study, 2022)
Frequently Asked Questions (FAQs)
- Q: Can the
debug.logfile be strategically relocated from its defaultwp-contentposition? - A: Absolutely, and it’s a highly recommended security measure for production environments. You can specify a custom path for the log file by defining
WP_DEBUG_LOGwith an absolute path outside your public web root. For example:define( 'WP_DEBUG_LOG', '/home/yourusername/logs/debug.log' );This ensures that the log file is not directly accessible via a web browser, even if server configurations are inadvertently insecure. Ensure the directory specified has appropriate write permissions for the web server user. - Q: What are the security implications of neglecting to disable
WP_DEBUGon a live production site? - A: Neglecting to disable
WP_DEBUG(especially ifWP_DEBUG_DISPLAYis left true) on a live production site has severe security implications. It exposes internal server paths, file names, database query errors, and potentially sensitive plugin/theme versions to the public. This information is invaluable to malicious actors, allowing them to map out your site’s architecture, identify potential vulnerabilities (e.g., outdated plugin versions), and craft more sophisticated attacks. It essentially provides a roadmap for exploiting your system, significantly broadening your attack surface and inviting breaches. - Q: My
debug.logis not being generated despite correct configuration; what is the first troubleshooting step in this operational oversight? - A: If your
debug.logisn’t generating despite correctwp-config.phpsettings (WP_DEBUGandWP_DEBUG_LOGboth true, placed correctly), the first troubleshooting step is to check the **file permissions** of thewp-contentdirectory. The web server user needs write access to this directory to create thedebug.logfile. Ensure the `wp-content` directory (or your custom log directory) has permissions of **755**. If that doesn’t resolve it, check for potential syntax errors in `wp-config.php` that might be preventing PHP from parsing the file correctly, or ensure no server-level PHP configurations are overriding your `WP_DEBUG` settings. - Q: How frequently should I conduct a review of my
debug.logfor proactive operational intelligence gathering? - A: The frequency of `debug.log` review depends on your site’s activity and criticality. For highly active or mission-critical sites, a daily review (or even real-time monitoring via WP-CLI’s `tail -f`) is recommended to catch emerging issues immediately. For moderate sites, a **weekly review** is a sound proactive measure. This allows you to identify recurring warnings or notices that could indicate underlying issues before they escalate into critical failures. Always conduct an immediate review after any significant changes, such as plugin/theme updates, core WordPress updates, or new code deployments.
- Q: Are there advanced methods for filtering or parsing
debug.logintelligence for more efficient analysis? - A: Yes, for large or verbose `debug.log` files, advanced filtering and parsing become essential.
- Command-Line Tools: On Linux/macOS, `grep` (e.g., `grep “PHP Fatal error” debug.log`), `awk`, and `sed` are powerful for filtering specific error types or keywords.
- Log Parsers: Dedicated log parsing software or online tools can help structure and analyze log data more effectively.
- Monitoring Solutions: Integrating with a centralized logging and monitoring solution like the ELK Stack (Elasticsearch, Logstash, Kibana), Splunk, or cloud-based services like Amazon CloudWatch/Google Cloud Logging allows for real-time ingestion, searching, visualization, and alerting on `debug.log` entries.
- Custom PHP Scripts: For bespoke analysis, a custom PHP script can read the log file, parse entries, and summarize or categorize errors based on your specific needs.
These methods transform raw intelligence into actionable insights, saving significant diagnostic time.
debug.log file is more than just a troubleshooting tool; it’s a window into the operational heartbeat of your WordPress site. By meticulously activating, accessing, interpreting, and managing this critical intelligence asset, you empower yourself to move from reactive problem-solving to proactive site stewardship, ensuring maximum uptime, optimal performance, and an uncompromised security posture in the ever-evolving digital landscape. Master your logs, master your site.